A One-Stop Resource for USPS Financial and Productivity Data
Tracking essential Postal Service financial information over time often means hunting through dozens of reports and other documents. We have a new tool to help.
The Postal Service publishes lots of important data reports on its own Financials page and in filings to the Postal Regulatory Commission (PRC). One key report is the Postal Service’s Form 10-K, which provides annual financial data.
The 10-K has great information, but each year’s report is a separate file. To compare the data over an extended period, someone has to open the separate reports and break out the individual data points.
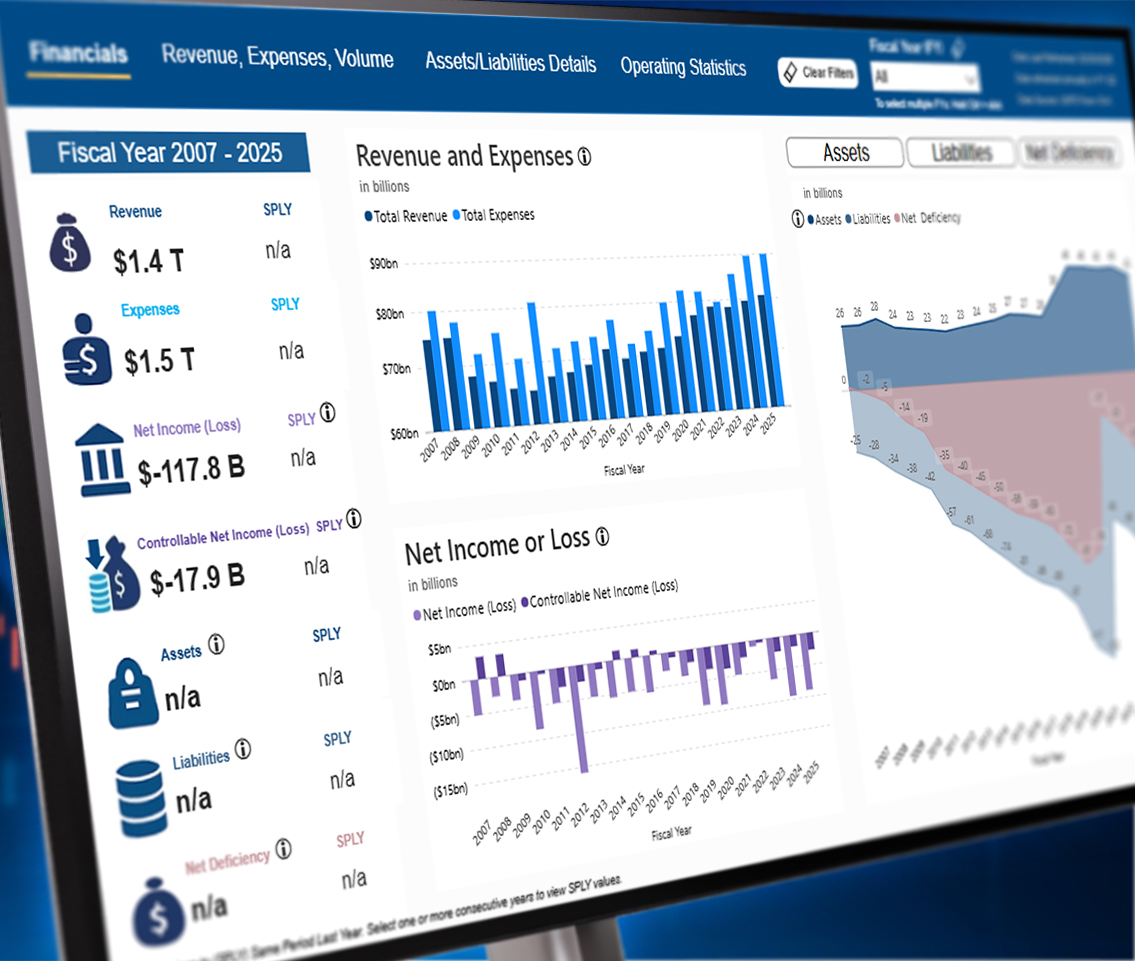
That’s where our new USPS Deeper Dive: Financials & Productivity dashboard comes in. This interactive tool on our website makes it easy to examine critical historic financial and operational data from USPS 10-Ks and PRC annual reports starting from fiscal year (FY) 2007. If you’re conducting research on the Postal Service or just trying to get a better understanding of its financials, this is a very useful tool.
So, what’s on the dashboard?
- Important financials including total revenue, total expense, net income (or loss), assets, and liabilities, and the Postal Service’s net deficiency;
- Breakouts of mail volume, revenue, and expenses by category;
- PRC estimates of the cost of the Postal Service’s universal service obligation and the value of its monopolies;
- Revenue from retail channels;
- USPS retirement fund surpluses or deficits; and
- Total Factor Productivity values, which measure efficiency.
Wait, there’s more! The page also has links to relevant OIG reports on the Postal Service’s financial performance and productivity.
Check out this new one-stop resource here, and let us know what you think in the comments section.
IMPORTANT - PLEASE NOTE: Complaints about the Postal Service — including lost, stolen or mishandled mail — that are unrelated to the content on this page will not be posted. Please visit the Contact Us page for information on where to file formal complaints with our agency or the Postal Service.
Leave a Comment
LEAVE A COMMENT
The inclusion of productivity metrics, revenue breakdowns, liabilities, and retirement fund data also gives a more complete picture instead of only showing basic financial summaries. Tools like this become especially valuable when people want to compare trends across multiple years without manually digging through dozens of PDFs.
I also think transparency and accessibility of public financial data are becoming increasingly important, especially for large government-related organizations that handle nationwide services and infrastructure.
I’ve been reading more discussions recently around public data systems, financial transparency, and digital reporting tools here as well: https://8171web-portals.pk/
Making complex financial information easier to access and visualize definitely helps improve public understanding and accountability over the long term.